Regulatory profitability formula
The rate of return is an economic indicator of the return on investment. talking plain language, this is the interest rate at which the net present value of the investment is zero (by investing your money, you will not lose anything, but you will not gain anything), i.e. there will be profit only if the real interest is higher than the rate of return.
You can calculate the rate of return (internal rate of return) IRR using the equation: CFm/(1+IRR)^m = I, where m is the period, CFm is the cash flow for this period, I is the amount of investment. The calculated indicator of the rate of return allows you to assess the feasibility of a particular business decision. For example, if a business project indicates the only source of income in the form of a loan, by calculating the IRR, you will see the boundary value of the annual rate on the loan, above which it makes no sense to issue it, since the project will then be unprofitable.


Do not forget that, like any other, the indicator of the rate of return is theoretical. In practice, it is almost impossible to achieve the calculated indicator: the real economic situation makes its own adjustments. In addition, when calculating, keep in mind that this indicator is sensitive to the structure of the payment flow, which is why it is sometimes impossible to evaluate mutually exclusive business projects. When alternating cash inflows and outflows, it is possible that there will be several values of the rate of return.
Being an absolute value, profit is related to the scale of production, depends on the size of the enterprise, which to a certain extent limits its analytical capabilities as a criterion for the effectiveness of its work in a market economy.
Indicators of profitability (profitability) of the enterprise allow us to evaluate its financial results and ultimately efficiency. These indicators usually include the level of profitability, or the profitability ratio, which is expressed as the ratio of one or another type of profit to any base. Numerous profitability indicators reflect different aspects of the enterprise. It is quite natural that, in general, the efficiency of an enterprise can be determined only by a system of profitability indicators.
Profitability of sales, which is calculated by the formula:
Rv (ROS)= (R/VR) 100%
where P - profit from sales;
Вр - sales revenue.
An increase in this indicator may reflect an increase in product prices at constant costs or an increase in demand and, accordingly, a decrease in unit costs. This indicator shows the share of profit in sales revenue, therefore, the ratio of profit in it and the total cost of sales. It is with the help of this indicator that an enterprise can decide on the choice of a way to increase profits: either reduce costs or increase production. This indicator, calculated on the basis of net income, is called net return on sales.
Return on assets (return on investment):
R A (ROA)= (P/A) 100%
where P is the profit of the enterprise (profit from sales, balance sheet or net profit can be used);
A - the average value of the assets (property) of the enterprise for a certain period.
This indicator reflects the efficiency of the use of all property of the enterprise. The dynamics of return on assets is a barometer of the state of the economy. As a factor of production, return on assets and its changes perform an incentive function in that it gives a signal to investors. At the same time, the strength of the signal depends on the quantitative assessment or the level of profitability of assets. The average return on assets in Japan is about 10.3%, and in the US -16.8%. In Japan, it is considered profitable if capital investments pay off in 7 years, and in the USA -4.5 years.
Return on assets can be represented as the product of the following two indicators:
R A \u003d R B * O A \u003d (P / BP) * (BP / A) \u003d (P / A)
where O A - asset turnover, turnover.
Thus, the profitability of assets is primarily influenced by two groups of factors related to the profitability of sales and asset turnover.
Usually, when analyzing the return on assets, an analysis of current assets is carried out, i.e. working capital, since their impact on this indicator significantly depends on the state and organization of working capital. The calculation is carried out according to the following formula:
R O C \u003d PE / OS
where PE is the net profit of the enterprise;
OS - the average value of the second section of the asset balance of the enterprise - current assets(working capital).
An enterprise can calculate the profitability of non-current assets (fixed assets and intangible assets) in a similar way, i.e. the first section of the asset balance.
Return on equity (share) capital reflects the profitability of the company's own funds:
R SC (ROE) = PR / SC
where SC is the average value of the enterprise's own capital for a certain period.
The peculiarity of this indicator is that, firstly, it shows the effectiveness of the use of own funds, i.e. net profit received on the invested ruble, and, secondly, the degree of risk of the enterprise, reflecting the growth of return on equity.
In conjunction with R SC, the famous Dupont formula can be used:
R SK \u003d (PE / BP) * (BP / A) * (A / SK)
This formula significantly expands the analytical capabilities of the enterprise, as a result of which it has the ability to determine:
· the dynamics of net profit in sales proceeds (profitability of sales);
· asset utilization efficiency based on sales proceeds and current trends (asset turnover);
· structure of the capital of the enterprise on the basis of that share which is made in actives by own means;
· the impact of the above factors on the return on equity.
In our joint discussions, we have repeatedly touched upon the theme of the complex nature of investment evaluation. Indeed, the composition of economic efficiency indicators is diverse, and the choice of the desired ratio of parameters is a methodologically difficult task. Most of these criteria take into account the time value of money, and rightfully so. Recently, another indicator began to gradually “wash out” from the literature - ARR (average rate of return). I think it's too early to write him off.
The content of the calculation of the average rate of return
Undoubtedly, the most important indicator for making a decision to launch investment project remains NPV. But for deeply elaborated conclusions, not only , but also , and is not enough. Some additional estimate, albeit less complicated, is required. One of these auxiliary criteria may well be the investment efficiency ratio - ARR (Accounting Rate of Return). This indicator has several names in the English and Russian financial and analytical interpretations:
- accounting rate of return;
- estimated level of income;
- simple rate of return;
- average rate of return.
The last two formulations are used to a greater extent in the domestic practice of investment analysis. In order to obtain an average return value, the indicator is determined as the average accounting profitability of the book value of the planned investments. This parameter does not take into account discounting mechanisms and is calculated as a result of dividing the average net income for the billing period by the average investment. To begin with, let's consider the formula for calculating the criterion from the perspective of the Western management school.
Suppose an investor is considering a decision to invest in the creation of a fleet of trucks in the amount of 75,000,000 rubles. The estimated period of the project is 7 years. The expected income from the implementation of the production program for the operation of rolling stock is planned at the level of 21,000,000 rubles annually. It is necessary to calculate the level of annual profitability, based primarily on the depreciation rate of investments. The calculation formula and the actual calculation example are given below.

An example of calculating the average rate of return according to the formula in the interpretation of the Western school
From the point of view of the domestic practice of investment analysis, the average rate of return is considered from somewhat different positions, but the essence of the indicator is the same. The average annual net profit from the project implementation is compared with the average value of investment investments, taking into account the liquidation value of the object. By an object, we mean fixed assets or intangible assets, which, as expected, should be depreciated by the end of the operational phase. However, these assets may still have a market value, and this cannot be ignored.
The expected rate of return from the standpoint of economic content illustrates how much net profit will be created per project on average for one ruble of investments made. To simplify the calculations, the depreciation of investments is taken into account through the use of the averaging fraction ½. The formula for calculating the indicator itself is as follows.
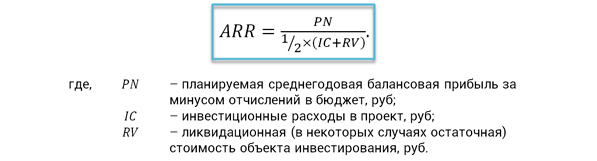
Investment Performance Ratio Formula
Advantages and disadvantages of the indicator
IN previous section we have considered two main algorithms for calculating the average rate of return. We use the last method the most. In the practice of comparing alternative investment decisions, reference ARR values are often used, which, taking into account available statistics and benchmarking results, are differentiated by:
- types of projects;
- financial responsibility centers;
- degree of project risk.
The advantages of ARR include the ease of perception and calculation of the indicator, the ability to quickly predict project profitability. This criterion, based on clear, substantiated information, takes into account the full duration of the life cycle of an investment project. In addition to the advantages, the investment efficiency ratio has a number of disadvantages, among them the following stand out.
- There is no reduction of the value of future receipts to current moment time.
- It is difficult to compare projects that have different duration and different dynamics of profit generation.
- Considers linear method depreciation of investments and is not applicable for other approaches.
The mentioned advantages and disadvantages of the criterion under consideration do not in themselves give a significant effect when making a decision on a specific project. They should be considered in the context of a systematic assessment of the effectiveness of investments. Much depends on the stage of decision making. Preliminarily evaluating the project, it is important to get an operational analytical cut. Criteria such as the average rate of return and the simple payback period are well suited for this. Moreover, in the conditions of short project terms and the obvious uniformity of the expected profit, these indicators give a completely adequate picture.
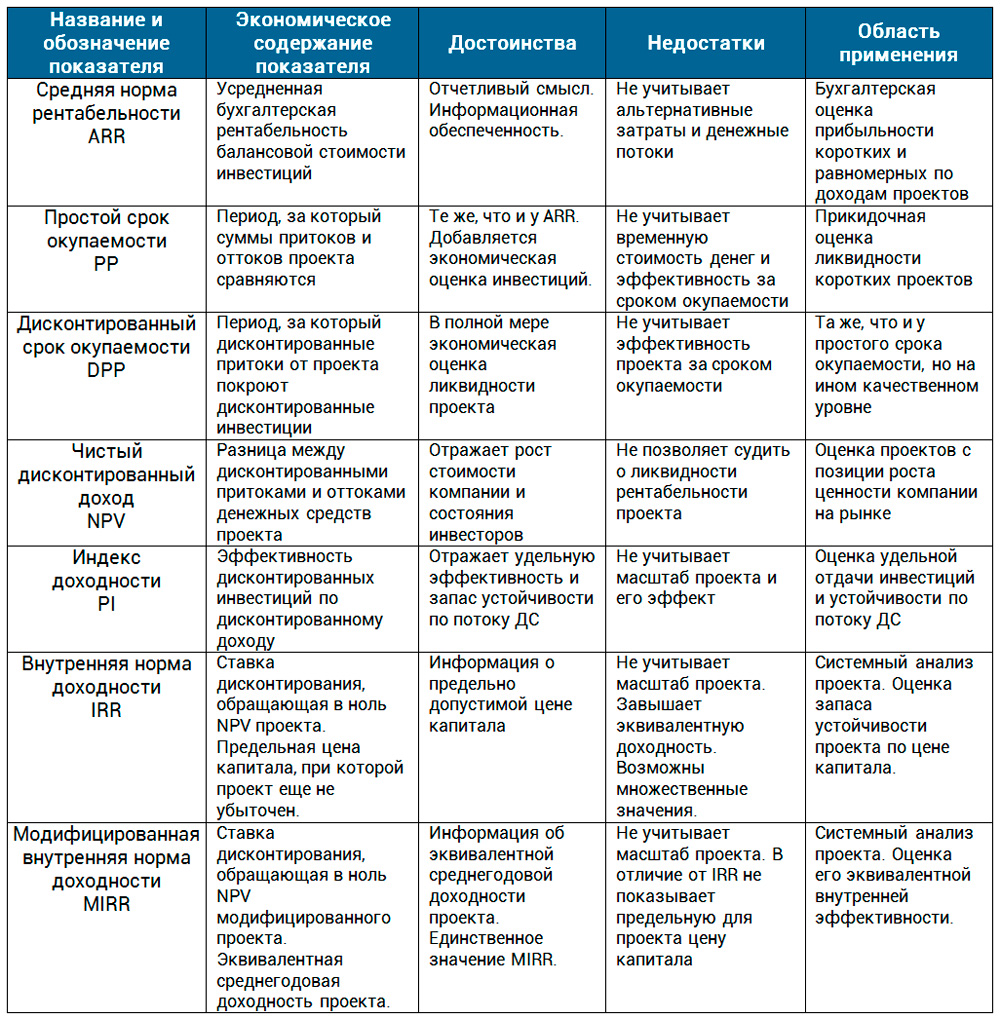
In difficult situations, with an increase in scale and duration, the solution is more responsible and requires an integrated approach. There is no longer any way to do without discounting mechanisms. cash flows and evaluation of other features of the project implementation. Next, we offer you a comparison of project performance indicators in tabular form.
In this article, we considered the average rate of return. This was the last indicator in our project appraisal reviews. In practice, this indicator is used by one of the first investment analysts, financial directors and PM at the moment when the head of the company or the investor requires an express response. It is important to understand the essence of this criterion. Its economic content lies in the identification of profitability, profitability of investments. It does not matter what is taken as the basis of the base effect - net income or NCF. Understanding this aspect makes any indicator formula accessible to perception, regardless of the literary source.
dtk tg2 buy dtk tg2 bramit.ru.